
TO: Jack Jennings
FROM: Matthew Frizzell
DATE: February 8, 2017
SUBJECT: Estimated percent of US’ education spending in 2013
The National Priorities Project concluded that the United States outpaces other countries by a significant margin in military expenditures — the US spends approximately 37% of all spending in the world for military purposes.i However, there is no comparison between US education spending as a percentage of total education spending around the world. This memo first describes a method for estimating the percentage of US’ education spending on primary and secondary education. Then, it approximates the spending increase needed if the US wants to spend the same percentage of global expenditures on education as it spends on the military.
Three steps were taken to calculate the per pupil spending increase if the US were to have spent 37% of education spending worldwide. First, I compiled the known spending on primary and secondary education for as many countries as possible, with a goal of including all Organization for Economic Co-operation and Development (OECD) countries and the ten most populous countries in 2013. Second, I estimated education spending for five countries that were missing after stage 1. Finally, I calculated the percentage of US’ education spending relative to education spending around the globe and used this information to estimate how much spending would have to increase if the US were to have spent 37% of the total spending on education in primary and secondary grades in 2013.
Stage 1: Known spending on education, by country
I started by collecting annual per pupil spending and student enrollment data for 2013 from the United Nations’ Education, Scientific, and Cultural Organization’s (UNESCO) Institute for Statistics’ (UIS) database.ii Per pupil expenditure is in constant USD (U.S. dollars).iii Both indicators are provided using the 2011 International Standard Classification of Education (ISCED) levels. For this analysis, I focused on elementary and secondary education (ISCED levels 1, 2, and 3). UIS provides an indicator for secondary education that combines ISCED levels 2 and 3.
Because the analysis was concerned with capturing as many countries that are members of the OECD as possible, I included OECD countries that had information from years other than 2013 (this expansion of years allowed for the inclusion of the following OECD-member countries: Belgium, Finland, Norway, and Switzerland).iv I then, expanded the sample to include non-OECD countries that had information available for 2011 or 2012. I took information from the most recent year if figures were available for both 2011 and 2012 (this expansion of years allowed for the inclusion of the following non-OECD-member countries: Bangladesh, Cameroon, Chad, Ethiopia, Fiji, Ghana, Guinea, Guyana, Ireland, Jordan, Kenya, Kuwait, Madagascar, Morocco, Oman, Panama, Paraguay, Republic of Moldova, Romania, Senegal, Serbia, Seychelles, South Africa, Swaziland, Togo, and Yemen).
In all, the analysis included 115 counties — five of which had estimated education spending figures. Appendix 1 shows per pupil spending on education and student enrollment by country and school level. The next section describes the additional steps taken to include those five countries.
Stage 2. Generating estimates for spending on education
In addition to including all OECD countries, I wanted to include the 10 most populous countries in the world. The 2013 country populations as reported by the United States Census Bureauv showed that the analysis was missing China, Nigeria, and Russia (the 1st, 7th, and 9th most populous countries in the world, respectively). To include these three countries, I estimated education spending for each.
The first step in estimating education spending was to create an education spending to military spending ratio for primary and secondary grade spans in the analysis.vi To create the ratios, I looked at all the countries that had data for education spending for primary and secondary education and military expenditure figures. Not all of the 110 countries with education spending data had military expenditure figures. The following 16 countries were not used to create the average education spending to average military spending ratio: Andorra, Bhutan, Chad, Comoros, Costa Rica, Guinea, Iceland, Iran, Laos, Mozambique, Niger, Puerto Rico, Saint Lucia, Saint Vincent and the Grenadines, Sao Tome and Principe, Senegal.
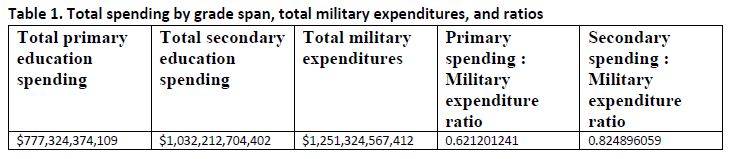
I used the total amount of education spending at the primary and secondary education levels and divided that into the total amount of military expenditures. (See table 1.) I estimated that for every dollar the 94 countries spent on the military they spent approximately $0.62 on primary education and $0.82 on secondary education.
These ratios were then applied to the military spending for Canada, China, Greece, Nigeria, and Russia for both primary and secondary education. That gave the total education spending by both grade spans. I then divided that total spending figure by the total population enrolled in elementary and secondary schools for 2013 (enrollment figures for 2013 were available in the UIS database) to get per pupil spending in the five countries.
Stage 3. Percentage of US’ education spending relative to worldwide spending
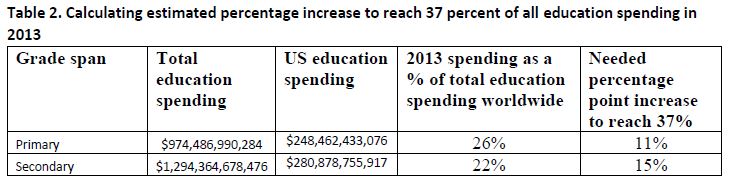
To obtain a needed increase in US education spending to reach 37 percent of all spending in 2013, I calculated the percentage of the US’ education spending relative to worldwide education spending by grade span. (See table 2.)
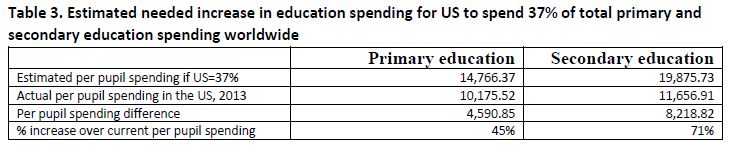
To calculate the primary per pupil expenditure for the US at the 37% mark, I multiplied total education spending for primary school by 0.37 and divided that figure by the US’ primary student population. I used the same method to calculate the US’ secondary per pupil spending at the 37% mark. Then, to calculate the needed percent increase over 2013 US education spending, I used the difference between per pupil spending at the 37 percent of education spending and the US’ actual per pupil spending in 2013. The difference was divided by the US’ actual spending on education by grade span, by grade level. (See table 3). If the US were to have spent 37% of the total education spending for the 115 countries in the analysis, it would have needed to increase its primary spending by an estimated 45% and its secondary spending by an estimated 71%.
However, when looking at simple rankings of countries by per pupil spending. Even an increase to 37% of worldwide spending in education would not be enough to make the US the biggest spender for primary and secondary education. As table 4 shows, the US becomes the fifth largest spender for primary education and the fourth largest for secondary education.

Limitations
The analysis of UNESCO’s UIS database originally included all countries that had per pupil spending and enrollment figures for 2013. However, when conducing an analysis of OECD only countries revealed that some OECD member countries were omitted from the analysis, I pulled the most recent data for those countries from 2011 or 2012. The expansion of the sample by year increases the number of countries in the sample but most likely does not capture their actual spending in 2013.
This analysis assumes some connection between education spending and military spending. However, I don’t know of any research that has established a direct link between education expenditures and military expenditures within countries. In my analysis, there are countries that spend more on education than military and others that spend more on military than education. The analysis used military spending to create a ratio because the nature of the blog post posits education spending against military spending.
There is also a limitation in terminology between countries. UNESCO defines government expenditures as the “average total (current, capital and transfers) general government expenditure per student in the given level of education, expressed in US$ at market exchange rates, in constant prices.”vii UNESCO also provides definitions for primary and lower and upper secondary. However, each country decides what qualifies as expenditure and which age ranges constitute primary and secondary education.
An additional limitation to this analysis is the estimated education spending. Because the analysis using only UIS information did not capture education spending for three of the 10 most populous countries in the world and two OECD countries, I estimated education spending for Canada, China, Greece, Nigeria, and Russia. However, SIPRI provides estimates for military expenditures for both China and Russia for 2013. This means that my estimate is based on another set of estimates.
Moreover, this analysis captures education spending for only 115 countries out of the 228 countries included in US Census Bureau’s website that lists each country’s population. This means the analysis excludes 113 countries. Including these countries in the analysis would only amplify the gap between what the US spends on primary and secondary education and the benchmark of 37% of worldwide spending on primary and secondary education. The analysis also does not consider government spending on tertiary education.
This analysis attempted to be as conservative as possible, but it is still possibly overestimated education spending in these five countries, which would lower the percentage of US education spending.viii However, I used the OECD database for 2013 education spending for 2013 and found that in 2013 the US spent 37% of all primary education spending in OECD countries and 32% of all secondary spending in OECD countries — this is only a difference of two percentage points for primary education and a percentage point for secondary education when compared to my analysis. This comparison gives me confidence in the accuracy of my estimates.
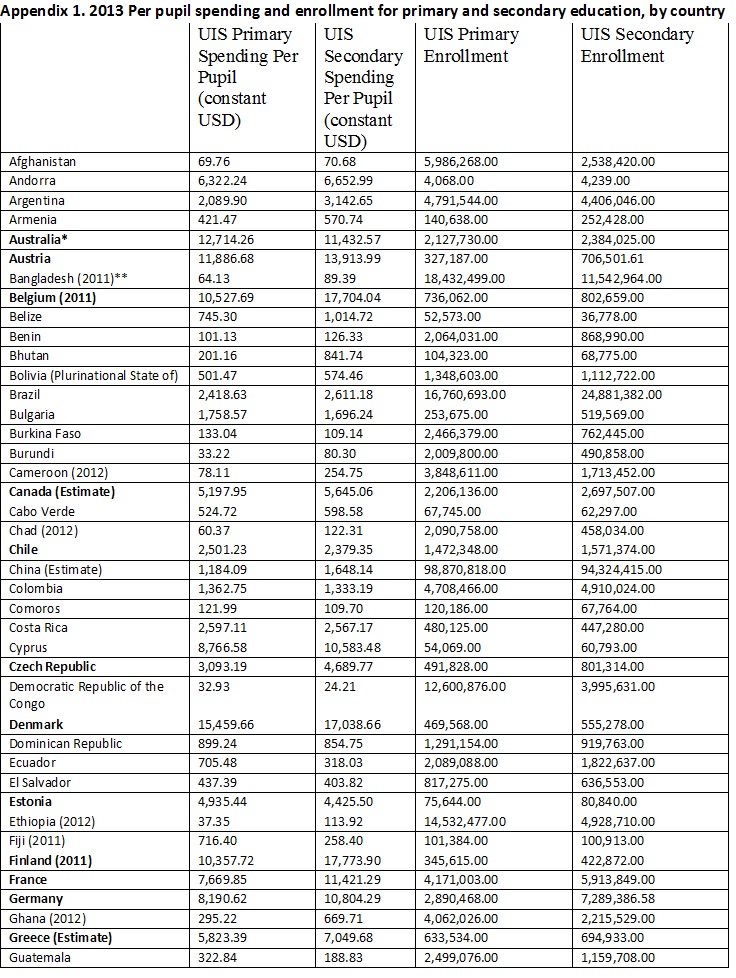
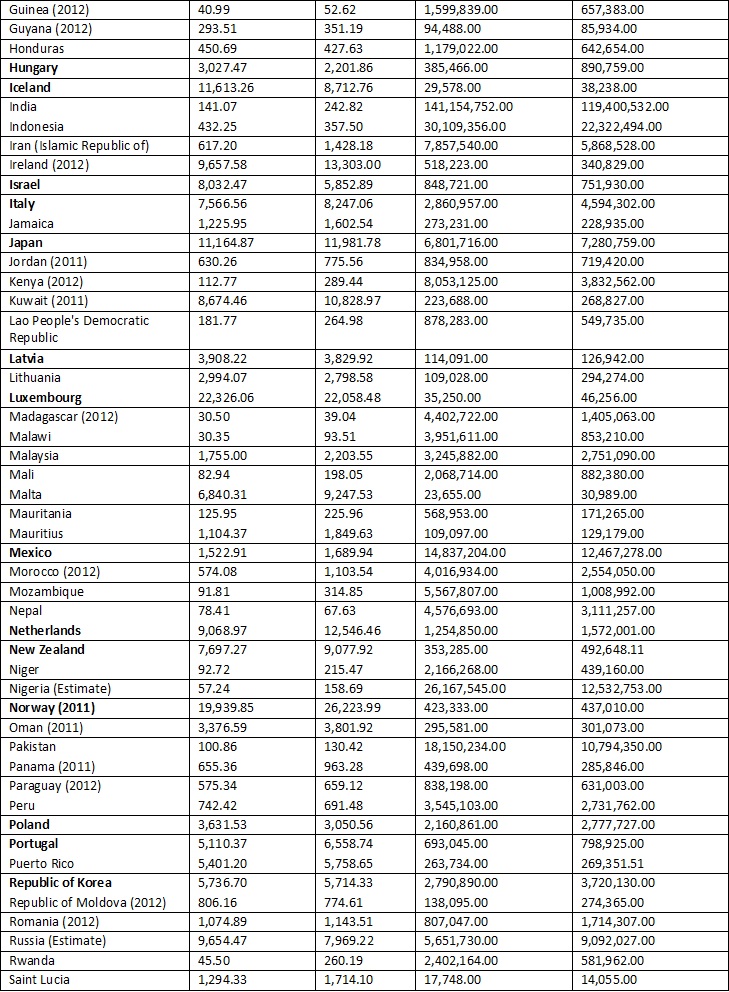
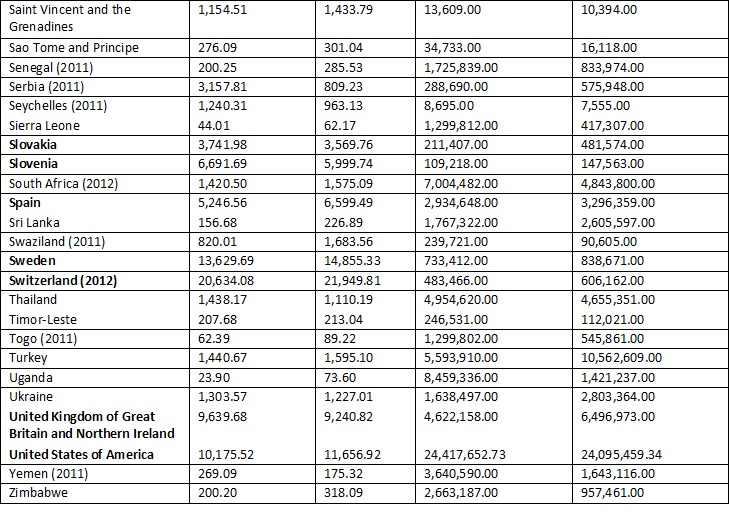
* Bold font indicated the country is a OECD member.
**Countries did not have education data for 2013 so data was pulled from either 2011 or 2012. The specific year is noted in the parentheses.
i. I believe that the National Priorities Projected included data for 140 countries in their analysis from SIPRI’s 2015 military expenditure database, but they don’t disclose the actual number. https://www.nationalpriorities.org/campaigns/us-military-spending-vs-world/
ii. 2013 was set as a base year because it was most recent year which had education spending figures for the United States.
iii. The UIS database normally reports the constant USD base year at three years before publication. I used the most recent education database, which was released in December 2016. Therefore, I worked under the assumption that the base year for determining the constant USD was 2013 and adjustments for inflation were not needed for data collected for 2011 and 2012.
iv. Despite expanding the data collection years to 2011 and 2012, Greece and Canada still had incomplete information in the UIS database and they were the two OECD countries for which I used the Stockholm International Peace Research Institute’s (SIPRI) military expenditure database to create estimates.
v. https://www.census.gov/population/international/data/countryrank/rank.php
vi. Data for military expenditures come from SIPRI. I used SIPRI’s 2014 Military Expenditure Database. This version allowed me to use their current USD tab to obtain military expenditure data for all countries with education expenditures and enrollments from 2013 — which was the most current year represented in the database. However, because SIPRI’s analysis of military expenditure using constant USD relied on 2011 dollars, I had to adjust for inflation for countries with education spending data from 2011 or 2012. (As noted above, I did not have to adjust the UIS education spending data for inflation.) I adjusted for inflation for 14 countries with 2011 military expenditure figures and 12 countries with 2012 military expenditure data. I used the US Department of Labor’s CPI (Consumer Price Index) Calculator to make the adjustments.
vii. http://uis.unesco.org/en/glossary
viii. According to the OECD’s Education at a Glance 2014, Canada spent $9,130 on per primary student in 2012 and $12,086 per upper secondary student. Both figures are well over the estimated per-pupil spending I calculated for Canada in 2013. So, while it is possible I have overestimated education spending worldwide using a ratio based on military spending, this example shows that I could have also underestimated worldwide education spending.